Thanks for the analysys and the sotry.
There should be a difference if they did'nt go faster at the beginning because they couldn't or because they didn't want to.
Specific 2k Pacing (Per 500m)
-
Mike Caviston
- 2k Poster
- Posts: 273
- Joined: April 20th, 2006, 10:37 pm
- Location: Coronado, CA
Having recorded & analyzed the results of 23 A-final races from the 2007 World Rowing Championships, the results are consistent with the past several years. A variety of pacing profiles were recorded with mixed results. Some crews started fast and went on to win, some came from behind, some led early but faded, and some were never a threat to win a medal. Such is racing. But again, the focus of the analysis was to compare medal winners (top three finishes) with crews that finished out of the medals. Across all races, the medal winners were on average about one second faster than non-medalists over the first 500m (absolute time). This difference was not statistically significant. But again, the way to meaningfully compare starts is to look at relative speed during different portions of the race (relative speed being a percentage of final average speed). The medalists on average had slower relative starts. The difference was small but statistically significant. I won’t bother with any graphs because the basic results are the same as what I’ve already provided.
Some examples of superior pacing (start not too fast, small variation in pace throughout) include Drysdale’s victory in the men’s single and the USA’s victory in the women’s 4-.
In the women's four, Megan Dirkmaat (San Jose, Calif.), Rachel Jeffers (Los Gatos, Calif.), Erin Cafaro (Modesto, Calif.) and Portia J. McGee (Seattle, Wash.) took control of the race during the second 1,000 meters and pulled away from the rest of the field for a 2.42-second victory.
(See http://www.row2k.com/news/news.cfm?ID=32331 for details.)
Michelle Guerette rowed a balanced race to secure a bronze for the USA in the women’s single.
Michelle Guerette (Bristol, Conn.) edged the Czech Republic's Mirka Knapkova at the finish line to win a bronze medal in the women's single sculls. Knapkova, a two-time world championships silver medalist in the event, led the race through the 1,500-meter mark, with Belarus' Ekaterina Karsten and Guerette following closely behind. As the scullers entered the final 500 meters, Karsten rowed through Knapkova, as did Bulgaria's Rumyana Neykova, a two-time Olympic medalist in the single. Over the final 100 meters, Guerette continued to press Knapkova and passed her in the final few strokes. Karsten continued her dominance in the event by winning her seventh single sculls title since 1996, crossing the finish line in a 7:26.52. Neykova finished second in a 7:27.91, followed by Guerette in a 7:28.48. Knapkova finished fourth in a 7:28.67.
I was saddened by the result for the Canadian women’s eight (with two former Michigan rowers), which led early but finished 6th (and just missed an automatic bid for Beijing). The US women’s eight (with another Michigan grad) won with a so-so pacing profile, as did the Canadian men’s eight. The biggest ingredient for success is to fill the boat with talented athletes, but I feel both crews could be even more dominant if they didn’t press so hard at the start. OTOH, they probably have more speed in reserve if necessary (the Canadian men in particular won pretty handily).
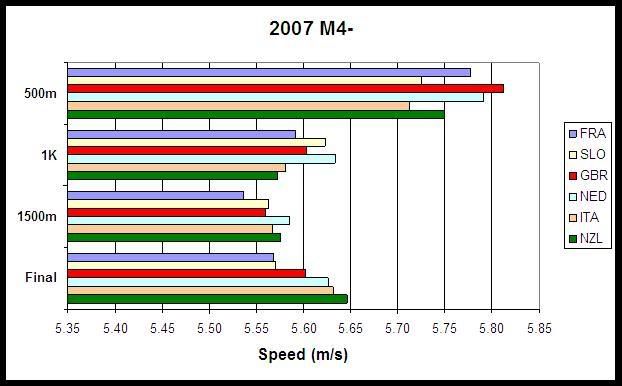
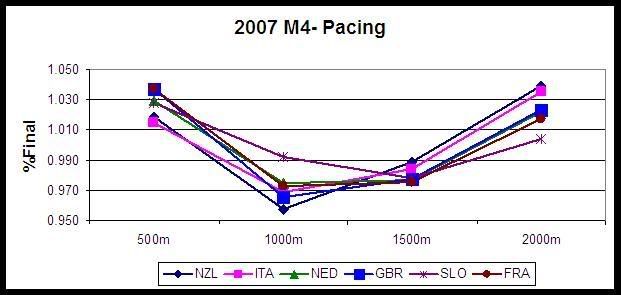
Many British fans will no doubt second-guess the technical alterations in the men’s four and wonder how results were affected. Another variable to consider is that (contrary to the statement by Triggs Hodge below), exceeding your base pace in the first 500m is a serious tactical mistake. The Kiwis had the right idea.
The flagship men's four - Steve Williams, Peter Reed, Alex Partridge and Andy Triggs Hodge - crashed from first to fourth to give coach Jurgen Grobler his second successive pre-Olympic failure. Reed said: "At 1,100 to go, we planned to make the race too fast for everybody else".
But it was New Zealand who did that, towed up from sixth to first by a Dutch push beside them, into the perfect position to use their blistering sprint to win gold. Britain were left floundering as Italy and Holland cleaned up the minor medals.
A stunned Williams said: "We're just very shell-shocked; we don't have the answers right now. Something was missing today, and everything we were trying to do just wasn't coming out in boat speed."
Stroke Triggs Hodge agreed. "I don't think it was much to do with tactics or mistakes. There were three crews out there had a base speed better than us."
(http://www.telegraph.co.uk/sport/main.j ... oww102.xml)

Some examples of superior pacing (start not too fast, small variation in pace throughout) include Drysdale’s victory in the men’s single and the USA’s victory in the women’s 4-.
In the women's four, Megan Dirkmaat (San Jose, Calif.), Rachel Jeffers (Los Gatos, Calif.), Erin Cafaro (Modesto, Calif.) and Portia J. McGee (Seattle, Wash.) took control of the race during the second 1,000 meters and pulled away from the rest of the field for a 2.42-second victory.
(See http://www.row2k.com/news/news.cfm?ID=32331 for details.)
Michelle Guerette rowed a balanced race to secure a bronze for the USA in the women’s single.
Michelle Guerette (Bristol, Conn.) edged the Czech Republic's Mirka Knapkova at the finish line to win a bronze medal in the women's single sculls. Knapkova, a two-time world championships silver medalist in the event, led the race through the 1,500-meter mark, with Belarus' Ekaterina Karsten and Guerette following closely behind. As the scullers entered the final 500 meters, Karsten rowed through Knapkova, as did Bulgaria's Rumyana Neykova, a two-time Olympic medalist in the single. Over the final 100 meters, Guerette continued to press Knapkova and passed her in the final few strokes. Karsten continued her dominance in the event by winning her seventh single sculls title since 1996, crossing the finish line in a 7:26.52. Neykova finished second in a 7:27.91, followed by Guerette in a 7:28.48. Knapkova finished fourth in a 7:28.67.
I was saddened by the result for the Canadian women’s eight (with two former Michigan rowers), which led early but finished 6th (and just missed an automatic bid for Beijing). The US women’s eight (with another Michigan grad) won with a so-so pacing profile, as did the Canadian men’s eight. The biggest ingredient for success is to fill the boat with talented athletes, but I feel both crews could be even more dominant if they didn’t press so hard at the start. OTOH, they probably have more speed in reserve if necessary (the Canadian men in particular won pretty handily).
Many British fans will no doubt second-guess the technical alterations in the men’s four and wonder how results were affected. Another variable to consider is that (contrary to the statement by Triggs Hodge below), exceeding your base pace in the first 500m is a serious tactical mistake. The Kiwis had the right idea.
The flagship men's four - Steve Williams, Peter Reed, Alex Partridge and Andy Triggs Hodge - crashed from first to fourth to give coach Jurgen Grobler his second successive pre-Olympic failure. Reed said: "At 1,100 to go, we planned to make the race too fast for everybody else".
But it was New Zealand who did that, towed up from sixth to first by a Dutch push beside them, into the perfect position to use their blistering sprint to win gold. Britain were left floundering as Italy and Holland cleaned up the minor medals.
A stunned Williams said: "We're just very shell-shocked; we don't have the answers right now. Something was missing today, and everything we were trying to do just wasn't coming out in boat speed."
Stroke Triggs Hodge agreed. "I don't think it was much to do with tactics or mistakes. There were three crews out there had a base speed better than us."
(http://www.telegraph.co.uk/sport/main.j ... oww102.xml)
As a former jockey a LONG time ago (3rd leading apprentice jockey in the US in 1981 in races won), generally speaking, we would pace any given horse based on the way the horse liked to run. Most horses were "negavtive split types," but some were "fly and die types." If I rode the latter, I would certainly try to keep the horse's pace as reasonable as I could, but a horse with a "fly and die" mindset rarely listened to reason. Track condition also played a role but took a back seat to the preference of the horse. That all said, the "fly and die" types were more likely to come up short in the end. It was extremely frustrating riding horses like that. I ALWAYS preferred riding horses who, in their own way, favored running negative splits (measured in quarter-miles increments).Bob S. wrote:An interesting analogy, but flawed because of the fact that horses are not limited to strict lanes like the rowers are - for most races, at least. Perhaps it is a different situation in bumpers and in the Head of the Charles - I don't know, I have never seen these. On the ergs there is no way to box some one in and no rail to force the passers to swing out wide.TomR wrote:Read an article yesterday about the upcoming Kentucky Derby that said that this year there is a substantial contingent of horses w/ early speed. The question was whether those who break fast will burn each other out, leaving the way for a horse that lays off the pace to take the race by coming from behind.
I'll be interested to see how 2k pacing strategy appies to the Derby, which happens to be 2k.
Tom
Still, it would be interesting to hear what jockeys might say about their strategies.
Bob S.
Botton line, Mike's analysis lends itself well to horse racing too. Finish slightly stronger than you started, but don't start TOO slow. Hope I added something to the discussion. Now if I could just figure out how to row strapless!
-
Mike Caviston
- 2k Poster
- Posts: 273
- Joined: April 20th, 2006, 10:37 pm
- Location: Coronado, CA
Same with most rowers and coaches, in my experience!worldted wrote:a horse with a "fly and die" mindset rarely listened to reason
Thanks for the fresh perspective. If you (or anyone else) know where to find splits for horse races, please let me know. I’d love to do some analyses. For that matter, if anyone knows where to find splits for any events besides what I’ve presented in this thread, please let me know. FISA and FINA seem to be the only world governing organizations that provide split data for their championships. I’d like to find more data for running, cycling and skating.

I think the individual and/or team pursuit in track cycling would be great to compair to rowing. Here's a link to one set of splits to start with and I'm sure google could turn up others.
http://www.britishcycling.org.uk/press/ ... Day3.shtml
http://www.britishcycling.org.uk/press/ ... Day3.shtml
If you don't try, you will never know how bad you suck.
Master D (54) / 208#
500M/1:38, 2K/7:02.3, 6K/22:17, 10K/38:31, 30'/7,700M, 60'/15,331M, HM /1hr 23:03 (all done back in 2007)
Master D (54) / 208#
500M/1:38, 2K/7:02.3, 6K/22:17, 10K/38:31, 30'/7,700M, 60'/15,331M, HM /1hr 23:03 (all done back in 2007)
hour cycling record splits
Hi Mike there is a really interesting site with the splits from the hour cycling record (scroll to bottom and click on links).
http://www.wolfgang-menn.de/hourrec.htm
http://www.wolfgang-menn.de/hourrec.htm
-
Mike Caviston
- 2k Poster
- Posts: 273
- Joined: April 20th, 2006, 10:37 pm
- Location: Coronado, CA
I’ve compiled a lot of data I haven’t bothered presenting here, since it just continues to support what I’ve already presented and doesn’t really add anything new. I have indoor data expanded with last year’s WIRC results. I have results of Junior Worlds rowing championships from the past several years. I have more analyses of swimming World Championship races. I have results from this year’s Head Of The Charles regatta to demonstrate that pacing also matters in head races. I have data from the Great Britain Senior Trials (October 21st) that demonstrates the same, as well as showing that ergs do float (I suspect the results would be even stronger if 5K or 6K was used for the erg test rather than 2K).
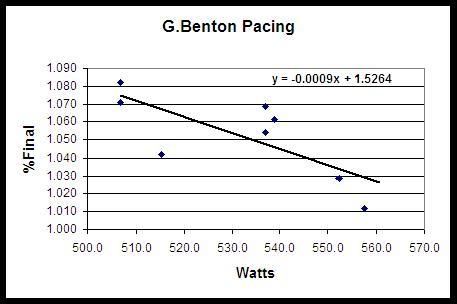
All of this is cross-sectional data, which in large amounts repeated over and over is pretty compelling. However, it would be great if there were more longitudinal data (the same subject tested at different times using different strategies). I’ve used Great Britain’s Graham Benton as a case study in the past, and Graham just set another personal best on the erg in this year’s BIRC, coming within a couple tenths of a second of setting the GB national record. Below is an updated summary of Graham’s major races, providing further evidence that Graham performs better with more conservative starts. If Graham’s race plan ever progresses to complete negative splits, I predict he will not only set the GB national record, but become one of the few people to go sub-5:40.

All of this is cross-sectional data, which in large amounts repeated over and over is pretty compelling. However, it would be great if there were more longitudinal data (the same subject tested at different times using different strategies). I’ve used Great Britain’s Graham Benton as a case study in the past, and Graham just set another personal best on the erg in this year’s BIRC, coming within a couple tenths of a second of setting the GB national record. Below is an updated summary of Graham’s major races, providing further evidence that Graham performs better with more conservative starts. If Graham’s race plan ever progresses to complete negative splits, I predict he will not only set the GB national record, but become one of the few people to go sub-5:40.
-
Mike Caviston
- 2k Poster
- Posts: 273
- Joined: April 20th, 2006, 10:37 pm
- Location: Coronado, CA
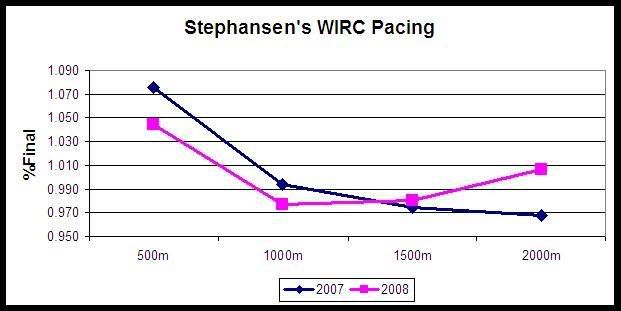
The 2008 CRASH-B indoor race has come and gone, and when the complete competitors’ data becomes easily accessible I’ll analyze it and combine it with results from previous championships. In the meantime, below is a comparison of two hammer-producing races by Henrik Stephansen (Open Men’s LW). This year’s effort resulted in a new world record. Note that the significant improvement this year was accompanied by a considerably more conservative start (104.4% vs. 107.6%). Some critics will say we can’t make comparisons between races because we don’t know anything about Henrik’s training, health, motivation etc. from one race to the next. Very true. What we do know is that in 2008 his opening 500m (relative start) was 3% slower than in 2007, and he finished over 4 seconds faster. Add that to the mountain of evidence I’ve already accumulated which supports slower starts as a prerequisite for faster performances. If anyone wants to seriously make a case for faster starts, they need to come up with a counter-example: provide some evidence of an elite athlete showing improvement from one race to the next by starting even more aggressively.
Henrik mellowed out a bit at the start this year compared to last, but he can still throttle back a bit more. Prediction: he will go under 6:00 if he exercises enough restraint to keep the first 500m a little slower than 1:30.

Henrik mellowed out a bit at the start this year compared to last, but he can still throttle back a bit more. Prediction: he will go under 6:00 if he exercises enough restraint to keep the first 500m a little slower than 1:30.
-
NavigationHazard

- 10k Poster
- Posts: 1789
- Joined: March 16th, 2006, 1:11 pm
- Location: Wroclaw, Poland
Actually, Mike, he's supposedly already done 1999m in a 6-minute gas-exchange lactate test, breathing into a tube 
I think he'd probably have been under 6 minutes a week ago if he'd been able to race in his own time zone.
None of which is meant to take away from your comments on his pacing.
I think he'd probably have been under 6 minutes a week ago if he'd been able to race in his own time zone.
None of which is meant to take away from your comments on his pacing.
67 MH 6' 6"
-
Mike Caviston
- 2k Poster
- Posts: 273
- Joined: April 20th, 2006, 10:37 pm
- Location: Coronado, CA
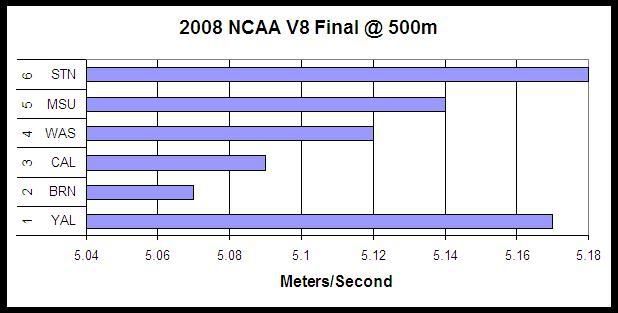
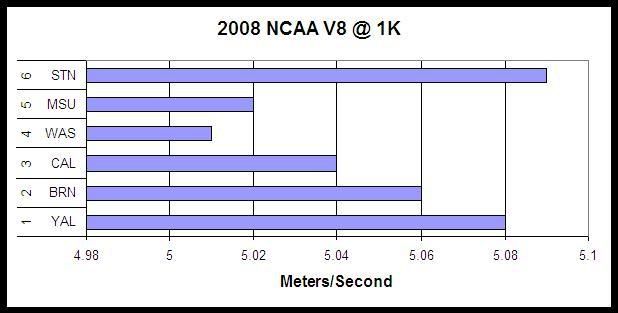
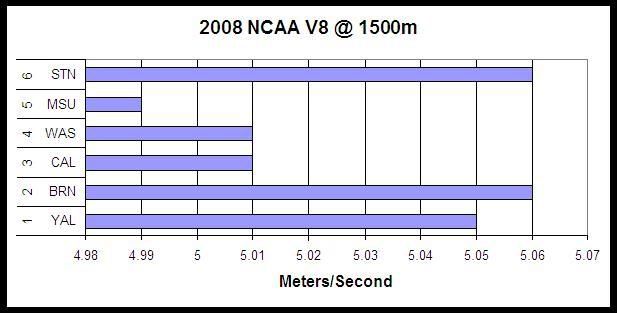
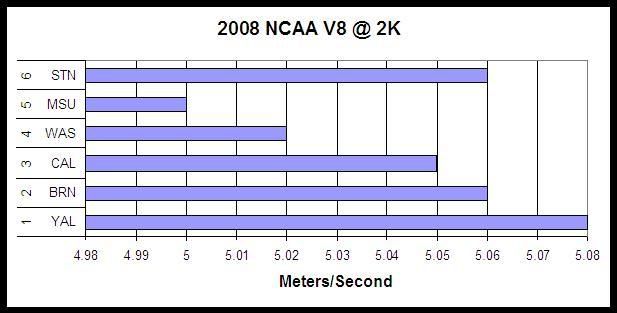
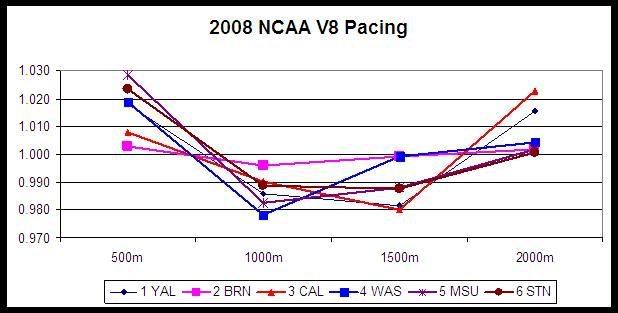
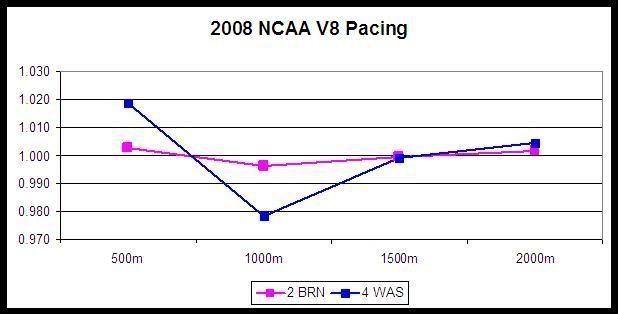
The 2008 women’s NCAA championship concluded yesterday with Yale repeating as champ in the first varsity 8, and Brown adding another team title, it’s sixth since rowing became an NCAA-sanctioned sport. Washington, historically the most successful program after Brown, showed strong late-season improvement to finish second as a team. After the first two events (V4 and 2V8), it was clear that the point total would go to either Washington or Brown, depending on who finished ahead of the other in the 1V8. Washington took the early lead, but couldn’t prevent Brown from coming from behind to grab the team trophy.

-
Mike Caviston
- 2k Poster
- Posts: 273
- Joined: April 20th, 2006, 10:37 pm
- Location: Coronado, CA
Hi Tom,
I know a few coaches are revising their race strategy, because they’ve contacted me to talk about it. I have suspicions about a few other programs, but no direct knowledge. The coaches that have been teaching their crews to start more conservatively have been pleased with the results, and managed to win some races they hadn’t ordinarily won, or place higher in big regattas than they have in the past. As always, the comments they get from spectators and other coaches is something like, “Gee, if you guys would just work on the first half of the race you could be really fast.” Some people aren’t ever going to get it.
Cheers,
Mike
-
Mike Caviston
- 2k Poster
- Posts: 273
- Joined: April 20th, 2006, 10:37 pm
- Location: Coronado, CA
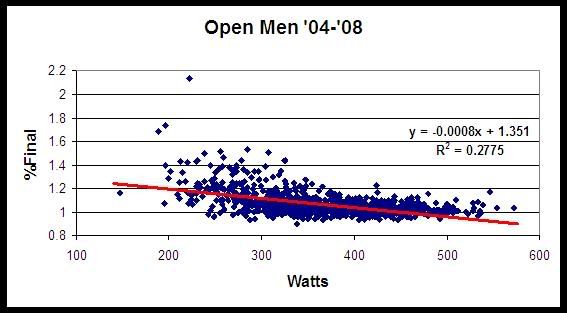
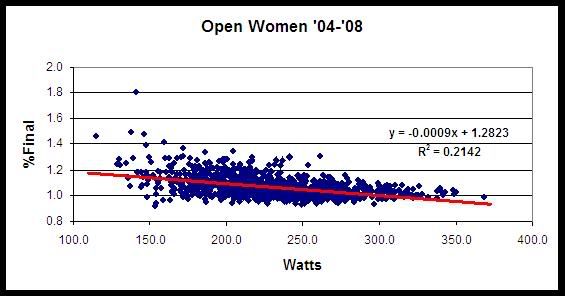
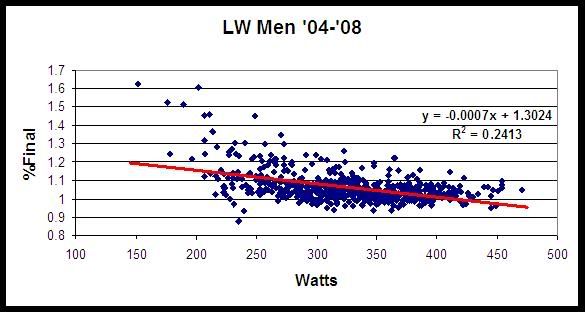
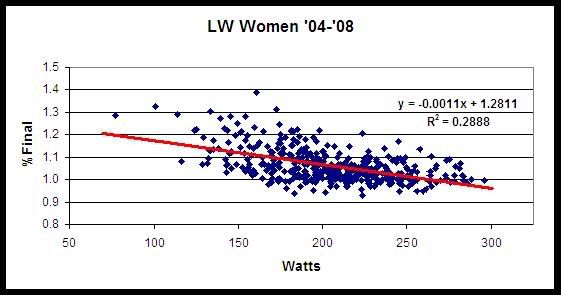
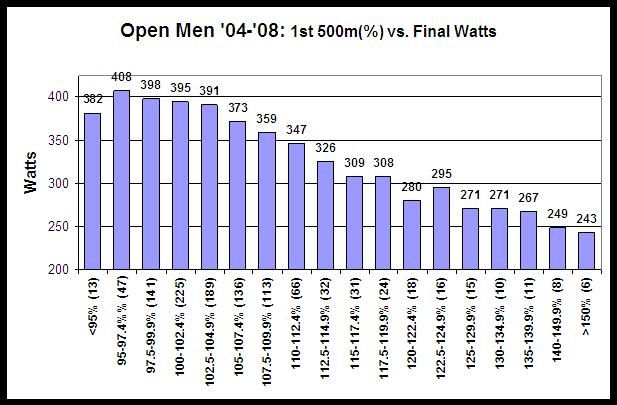
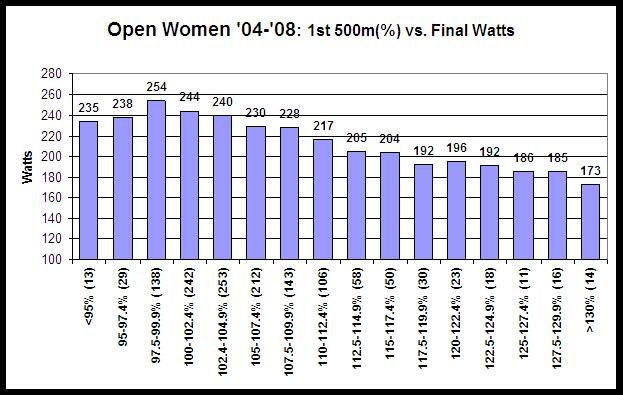
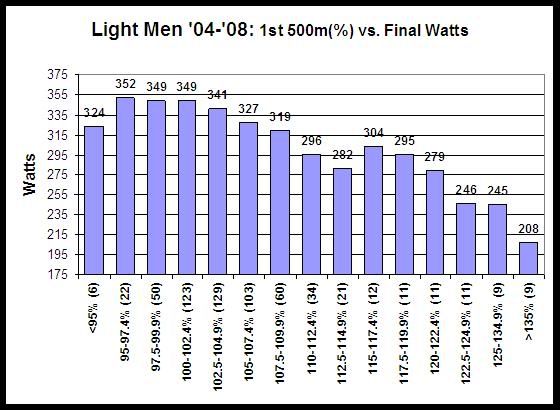
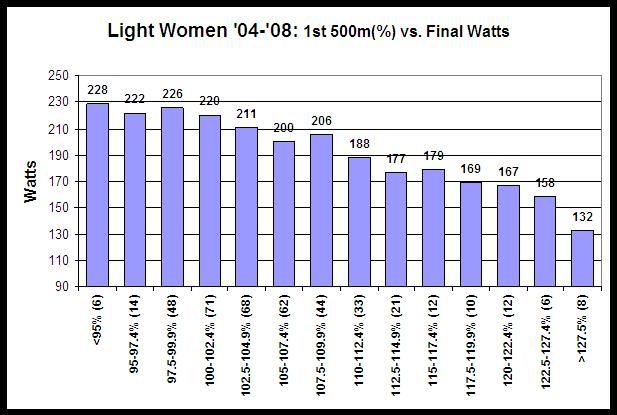
I have updated the analysis of results from the World Indoor Rowing Championship to include the 5-year period from 2004-2008. Included are 1099 races from the Open Men category, 615 races from Light Men, 1356 races from Open Women, and 415 races from Light Women. Overall, previous conclusions have even more statistical power and the actual data come closer to matching the theoretical ideal (the various graphs come out even cleaner and smoother). In five more years, I expect the composite results will match up just about perfectly with what I’ve predicted from the beginning. Here is an overall summary, with each category separated into 20% tiers. Key points are that faster times correlate with less deviation (“DEV”, representing the average deviation in Watts across all four 500m segments), and a smaller % of final 2K pace for the 1st 500m. The second table shows the average difference in power (Watts) between each category. For example (according to this sample), Open Men show 13% more power than Light Men, 61% more than Open Women, and 82% more than Light Women. LW show 55% of the power of OM, 62% of LM, and 88% of OW.


Scatterplots illustrate slow starts correlate well with more 2K Watts:
Bar graphs also illustrate that faster starts go with slower 2Ks in a predictable, quantifiable manner. Note that for each category the most power occurs when the opening 500m < 100% of final 2K power. The numbers in parentheses along the bottom axis represent the number of people in each start % segment. The overall distributions are normal or bell-shaped, with only a couple slight blips in the outlying segments with few subjects. As predicted, starting too slow (<95%) is also detrimental.
-
Mike Caviston
- 2k Poster
- Posts: 273
- Joined: April 20th, 2006, 10:37 pm
- Location: Coronado, CA
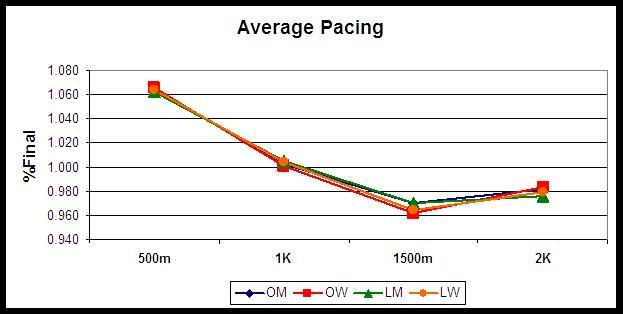
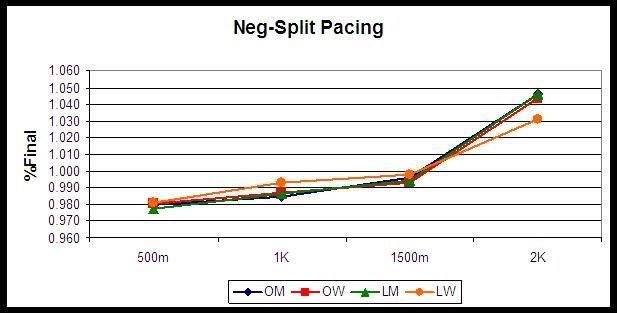
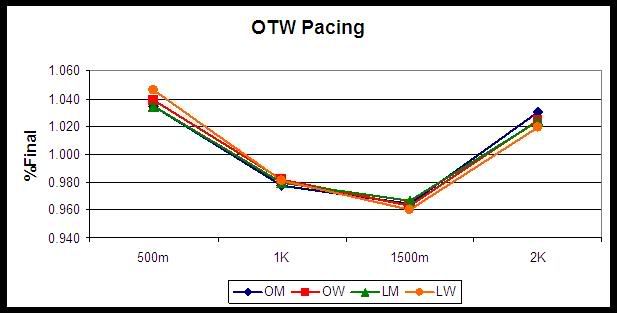
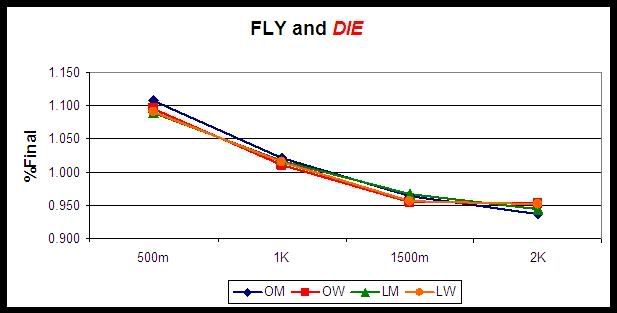
The overwhelming majority of subjects in this sample used a fly-and-die race strategy (if that can be called “strategy”). But conventional On The Water strategy (fast start, cruise the middle, sprint) is still quite popular, more so than the negative split strategy. Separating the results into these three strategies reveals that Neg Split is superior to OTW. This table summarizes the information, showing that Neg Split resulted in 10-20 more Watts than OTW across the different categories. The line graphs show the overall or combined pacing as well as pacing separated by strategy for the four groups.

-
Mike Caviston
- 2k Poster
- Posts: 273
- Joined: April 20th, 2006, 10:37 pm
- Location: Coronado, CA
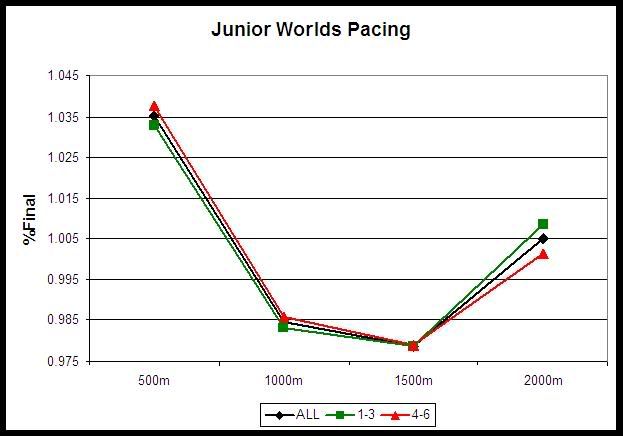
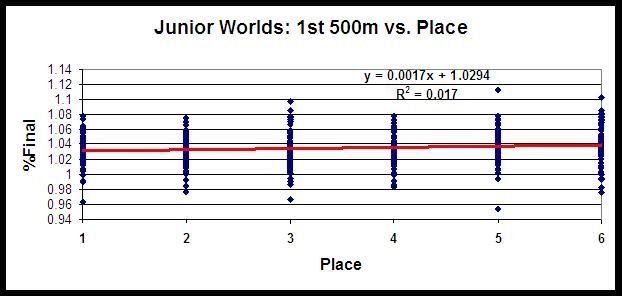
I continue to assert that the same principles of physics and physiology apply to OTW racing as well as indoor racing. In other words, despite conventional wisdom, the best strategy for winning races on the water is to start conservatively and get progressively faster during the race. After the Olympics, I’ll update the data for World Championship and Olympic Finals going back to 1996. In the meantime, here are results from A-final races from the Junior Worlds from 2002 and 2004-8 (there is no data for 2003). This represents 76 races and 456 crews. The table summarizes data for all competitors combined; separated by medalists and non-medalists; and by each individual place (1-6). The line graph compares the medalist pacing profile with the non-medalists as well as the combined or overall average. The difference is subtle but statistically quite significant. Separating the crews by individual place shows a general trend, but the sample size is not large enough to smooth out the effects of variability. The second graph shows that despite plenty of variability, there is a general trend for more conservative starts to be associated with placing closer to first. OTW data makes it hard to illustrate the value of the Neg Split race strategy, since historically so few crews have used it that a meaningful statistical comparison is not possible. Of the 456 crews in this sample, 22 (4.8%) used negative splits. The average place of the Neg Split crews was slightly better than others: 3.3 vs. 3.5.