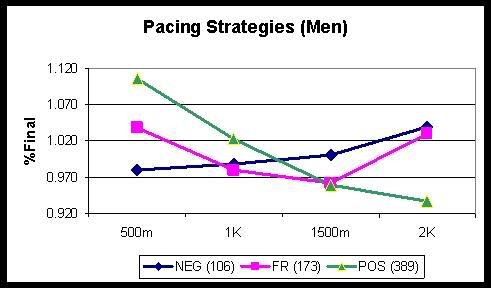
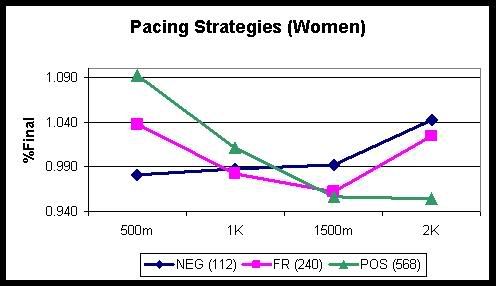
My general premise for this pacing discussion is that expending too much energy too early in a race accelerates the processes of fatigue. A pacing strategy that emphasizes a fast start results in a late fade and poorer performance than a strategy that emphasizes more even pacing. I’m particularly interested in applying this to indoor and OTW rowing, but I’ve looked at events of similar duration from running, cycling, swimming, and skating to demonstrate an overall phenomenon of fast starts/poor performance that transcends any single activity. The overall results show pretty clearly that for all events lasting approximately as long as a 2K rowing race, more successful athletes at the Olympic/World Championship level use relatively slower starts than their opponents. My recent analyses show this trend also exists for events that are shorter in duration than a rowing 2K. Specifically, I’ve looked at Olympic/WC results for cycling 1K, running 800m, skating 1000m & 1500m, and various 200m & 400m swimming events with a range of times from roughly one to four minutes. The application to rowing is for those attempting to set personal best times for 1K or 500m on the ergometer. The most common strategy used involves getting the initial split as low as possible and hanging on as long as possible (especially for 500m). It seems to be widely accepted that a fade at the end is inevitable and going as hard as possible early is the only way to stimulate maximal metabolism. There is also a perception that for shorter events, there isn’t enough time for processes of fatigue to become fully initiated (i.e., maximal buildup of lactate, etc.) While a couple minutes may not be enough time to reach maximal lactate levels, pushing the pace too hard at the start will still result in a greater accumulation of fatiguing agents that will reduce overall performance. This has been generally (though not universally) validated in the clinical research I’ve cited previously. It’s also been my general observation during years of watching rowers achieving their best and worst performances during various workouts. So my general advice for anyone trying to achieve their best time for a 500m or 1K sprint (actually, anything over 1 minute) is to try to have a realistic estimate of your best possible time, and settle into that pace but no faster right off the start. If your goal is to beat a previous best time, start out at the exact average pace of that best time and try to sprint a bit harder at the end.
Below is a table summarizing the pacing comparisons of the events I analyzed. The 800m run is from the ’84 Olympics. The skating is from the ’02 Olympics. The cycling combines results from the ’92, ’96, and ’00 Olympics; the swimming combines results from the ’00 & ’04 Olympics as well as the ’05 World Championships. I’ve included the number of competitors for each analysis; the average time for the top half and bottom half of each field; the % difference in time between the top & bottom halves of the field; the length of the first segment of each event from which the start % was derived; and the start % (that is, the pace of the first segment as a % of final pace, as I’ve done for all the previous analyses). The final column in the table contains the P-value for each comparison, which again is a measure of the statistical significance. Only a third of the analyses actually reached statistical significance, though the rest were generally pretty close. The men’s 200m freestyle & breaststroke swimmers actually showed a slightly higher start % for the “winners”. Overall the evidence in favor of slower starts is not overwhelming, and I wouldn’t claim it is absolutely definitive. But I would say it provides some solid evidence that a relatively slower start is a more effective race strategy than an all-out start, even for shorter sprint events. Note that the strongest individual analysis is for the shortest event (the 1K cycling TT), which had the greatest number of subjects. I believe that if I can eventually find enough data to analyze, I can show even stronger statistical evidence across the board.