Age>500 m> 1000m> 2000m
30 > 1:24.5 > 2:57.8 > 6:06.4
40 > 1:24.7 > 3:01.0 > 6:18.2
50 > 1:24.2 > 3:03.3 > 6:25.1
60 > 1:29.9 > 3:16.7 > 6:42.5
70 > 1:38.4 > 3:29.1 > 7:13.4
80 > 1:41.1 > 3:47.2 > 7:42.0
and here is the (rough) calculated fall within each distance:
Age>500 m> 1000m>2000m
30 > 100% > 100% > 100%
40 > 100% > 98% > 97%
50 > 100% > 97% > 95%
60 > 96% > 89% > 90%
70 > 83% > 82% > 82%
80 > 80% > 72% > 73%
From the second table we can surmise the following averages drops:
Age>500 m> 1000m>2000m
30 > ...
40 > (avg = 98%) IOW: 2% less than the 30 yr age group
50 > (avg = 97%) IOW: 3% less
60 > (avg = 92%) IOW: 8% less
70 > (avg = 82%) IOW: 18% less
80 > (avg = 75%) IOW: 25% less
John: I hope you won't be offended that I feel that discussion of the Perathlon scoring system is rather tangential to what I'm trying to illustrate here.
In other words, this thread was not conceived as place where on can learn how to quantify a 500 to 2000m performance or set of performances in relation to others.
I am interested, rather, in how far off a curve generated by considering all WR performances one could expect a new world record to occur. Is it statistically acceptable to expect a bone fide result at 500m, 1k, or 2k that deviates from such an age vs performance to be 1% ? 2%? faster??
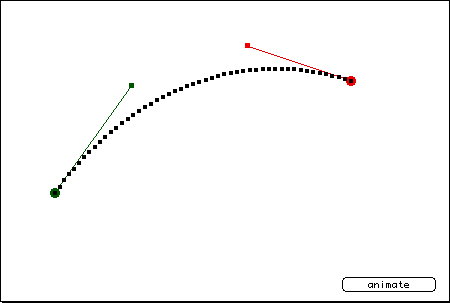
Here, for lack of a better graphic model, is a curve: Imagine that is was created using the column
in bold of 2000m WR from the top of this post.

Now, what interests me is the cluster of future performances that would populate the white space below and above the curve. (Any above would be, by definition, a new WR) If we turned the whole drawing 90 degrees clockwise it would illustrate my point more readily for we would have a smooth downward sloping curve to the right, just like our age vs WR data.
Indulge me if you will. First: Ignore the red marking entirely (this is clip art after all)
With the the graph above rotated, consider the green dot and the green square connected by the green line. This approximates the phenomenon of a new WR performance made by an older WR holder.
How far can the green square be expected to deviate from the curve of previous WRs (represented by the chain on little black squares?
We would need a scale on this drawing.
The deviation percentage couldn't be very much, could it? There has to be a limit. I'd suspect it would be one that is far less than the y-axis value of another data point represented by a younger WR holder as long as that younger WR holder was substantially younger...(say: 10 years)
I know this line of reasoning probably bores the socks off most trying to fathom what's going on here.
I'll stop for now.. Maybe forever if no one else finds this at all interesting.
What I'm saying clearly does not apply to the 500m records. I am interested only in the distances around 2k: the international standard for racing OTW and OTErg.


