An examination of WR lightweight marks age 30 on up

General discussion on Training. How to get better on your erg, how to use your erg to get better at another sport, or anything else about improving your abilities.
pmacaula
1k Poster
Posts: 130
Joined: September 22nd, 2008, 4:50 pm

Re: An examination of WR lightweight marks age 30 on up

Post by pmacaula » January 28th, 2010, 10:23 am

mikvan52 wrote:Image
Is that a typo or did a 13 year old Dan Warren really do a 1K in 2:57.0 ?

If so, gotta believe he was recruited directly to the national team of whatever country he is from & will not be a Ltwt by the time he is done growing !

Cheers. Patrick.

User avatar
mikvan52
Half Marathon Poster
Posts: 2648
Joined: March 9th, 2007, 3:49 pm
Location: Vermont

Re: An examination of WR lightweight marks age 30 on up

Post by mikvan52 » January 28th, 2010, 11:45 am

pmacaula wrote:
mikvan52 wrote:Image
Is that a typo or did a 13 year old Dan Warren really do a 1K in 2:57.0 ?

If so, gotta believe he was recruited directly to the national team of whatever country he is from & will not be a Ltwt by the time he is done growing !

Cheers. Patrick.
If it's a typo; it's C2's :D
If it's not for real..... (hmmm)

In my experience as a coach of runners and rowers: parents who start their kids that early burn them out before the reach college..... (I mean to limit this observation to endurance sports). Finesse sports like golf and tennis don't count.

..or, maybe "Dan Warren" is, in fact, a 13 yr-old pit bull terrier and they tied some meat to the erg handle :arrow: :| :mrgreen:

User avatar
Citroen
SpamTeam
Posts: 8010
Joined: March 16th, 2006, 3:28 pm
Location: A small cave in deepest darkest Basingstoke, UK

Re: An examination of WR lightweight marks age 30 on up

Post by Citroen » January 28th, 2010, 2:58 pm

mikvan52 wrote:
If it's a typo; it's C2's :D
If it's not for real..... (hmmm)

[snip]

..or, maybe "Dan Warren" is, in fact, a 13 yr-old pit bull terrier and they tied some meat to the erg handle :arrow: :| :mrgreen:
Could be a misconfigured PM3/PM4 on his ergo.

User avatar
johnlvs2run
Half Marathon Poster
Posts: 4012
Joined: March 16th, 2006, 1:13 pm
Location: California Central Coast
Contact:

Post by johnlvs2run » January 28th, 2010, 2:59 pm

NavigationHazard wrote:if the 2k WRs represent the best possible performances on an erg, all Perathlon scores by all rowers at all other distances should be less than 1000 points.
Thank you for taking this interest in the perathlon. Actually the 2k is the only distance that has the 100 percent WR curve. Any new 2k records that are above 100 percent of the curve, result in an adjustment of the curve. I've not yet included updated WR's, notably Stepansen's 5:58.5, since September 08, 2008, though this would be relatively easy to do. Again, however, this would be only for the 2k. Also note my comment at the bottom of this post, that I did not say much about in the forum at the time, whereby the Perathlon revision could result in significantly higher scores for events on either side of the 2k. This is because the other 9 events are based on the previous year's rankings, rather than the fastest possible time for each of the other 9 events.

J. Ortega's 2:39.6 1k at age 25 yields 1017.6 Perathlon points.
I checked that and got 104.x points.
Andy Ripley's 50+ MHW record of 6:07.7 -- which has stood since 1998 -- yields but 969.2 Perathlon points.
Yes, because that time is not as close to the WR curve as some other 50+ performances.
If nothing else, why not calculate everything in relation to the 1k records, since Ortega's performance offhand looks like the single best result ever accepted as a record.
Because only the 2k is the most popular, most competitive event, and has the highest quality times and WRs.
bikeerg 75 5'8" 155# - 18.5 - 51.9 - 568 - 1:52.7 - 8:03.8 - 20:13.1 - 14620 - 40:58.7 - 28855 - 1:23:48.0
rowerg 56-58 5'8.5" 143# - 1:39.6 - 3:35.6 - 7:24.0 - 18:57.4 - 22:49.9 - 7793 - 38:44.7 - 1:22:48.9 - 2:58:46.2

User avatar
johnlvs2run
Half Marathon Poster
Posts: 4012
Joined: March 16th, 2006, 1:13 pm
Location: California Central Coast
Contact:

Post by johnlvs2run » January 28th, 2010, 3:02 pm

This was my inconspicuous post on Sep 08, 2008.
http://www.c2forum.com/viewtopic.php?p=104153#104153

- - - - - - -

I've completely revised and updated the Perathlon tables, based on the 2k world records as usual, and this time additionally on the Concept2 2008 final rankings for the other 9 events.

The result of this is that the 9 events on either side of the 2k will get significantly higher scores than before.

If there are any questions, I'm completely open to sharing how the various formulas are completed.

http://johnlvs2run.wordpress.com/perathlon/
bikeerg 75 5'8" 155# - 18.5 - 51.9 - 568 - 1:52.7 - 8:03.8 - 20:13.1 - 14620 - 40:58.7 - 28855 - 1:23:48.0
rowerg 56-58 5'8.5" 143# - 1:39.6 - 3:35.6 - 7:24.0 - 18:57.4 - 22:49.9 - 7793 - 38:44.7 - 1:22:48.9 - 2:58:46.2

User avatar
mikvan52
Half Marathon Poster
Posts: 2648
Joined: March 9th, 2007, 3:49 pm
Location: Vermont

Post by mikvan52 » January 28th, 2010, 6:03 pm


Age>500 m> 1000m> 2000m
30 > 1:24.5 > 2:57.8 > 6:06.4
40 > 1:24.7 > 3:01.0 > 6:18.2
50 > 1:24.2 > 3:03.3 > 6:25.1
60 > 1:29.9 > 3:16.7 > 6:42.5
70 > 1:38.4 > 3:29.1 > 7:13.4
80 > 1:41.1 > 3:47.2 > 7:42.0


and here is the (rough) calculated fall within each distance:

Age>500 m> 1000m>2000m
30 > 100% > 100% > 100%
40 > 100% > 98% > 97%
50 > 100% > 97% > 95%
60 > 96% > 89% > 90%
70 > 83% > 82% > 82%
80 > 80% > 72% > 73%

From the second table we can surmise the following averages drops:

Age>500 m> 1000m>2000m
30 > ...
40 > (avg = 98%) IOW: 2% less than the 30 yr age group
50 > (avg = 97%) IOW: 3% less
60 > (avg = 92%) IOW: 8% less
70 > (avg = 82%) IOW: 18% less
80 > (avg = 75%) IOW: 25% less


John: I hope you won't be offended that I feel that discussion of the Perathlon scoring system is rather tangential to what I'm trying to illustrate here.
In other words, this thread was not conceived as place where on can learn how to quantify a 500 to 2000m performance or set of performances in relation to others.

I am interested, rather, in how far off a curve generated by considering all WR performances one could expect a new world record to occur. Is it statistically acceptable to expect a bone fide result at 500m, 1k, or 2k that deviates from such an age vs performance to be 1% ? 2%? faster??

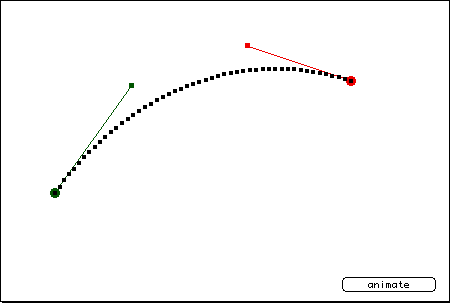
Here, for lack of a better graphic model, is a curve: Imagine that is was created using the column in bold of 2000m WR from the top of this post.
Image

Now, what interests me is the cluster of future performances that would populate the white space below and above the curve. (Any above would be, by definition, a new WR) If we turned the whole drawing 90 degrees clockwise it would illustrate my point more readily for we would have a smooth downward sloping curve to the right, just like our age vs WR data.

Indulge me if you will. First: Ignore the red marking entirely (this is clip art after all)
With the the graph above rotated, consider the green dot and the green square connected by the green line. This approximates the phenomenon of a new WR performance made by an older WR holder.
How far can the green square be expected to deviate from the curve of previous WRs (represented by the chain on little black squares?
We would need a scale on this drawing.
The deviation percentage couldn't be very much, could it? There has to be a limit. I'd suspect it would be one that is far less than the y-axis value of another data point represented by a younger WR holder as long as that younger WR holder was substantially younger...(say: 10 years)

I know this line of reasoning probably bores the socks off most trying to fathom what's going on here.

I'll stop for now.. Maybe forever if no one else finds this at all interesting.

What I'm saying clearly does not apply to the 500m records. I am interested only in the distances around 2k: the international standard for racing OTW and OTErg.

User avatar
johnlvs2run
Half Marathon Poster
Posts: 4012
Joined: March 16th, 2006, 1:13 pm
Location: California Central Coast
Contact:

Post by johnlvs2run » January 28th, 2010, 8:55 pm

mikvan52 wrote:I am interested, rather, in how far off a curve generated by considering all WR performances one could expect a new world record to occur.
Probably right on the curve would be the best prediction. For example, the record by Ripley could be improved by a new record on the curve.
Is it statistically acceptable to expect a bone fide result at 500m, 1k, or 2k that deviates from such an age vs performance to be 1% ? 2%? faster??
In the case of Ripley's record, it would be about 3% faster.

Stephansen's record is about 1% faster than were the records of Luini and Ebbesen.
Here, for lack of a better graphic model, is a curve: Imagine that is was created using the column in bold of 2000m WR from the top of this post.
http://www.moshplant.com/direct-or/bezier/curve01.gif
Nosmo created a similar curve from the Perathlon a few years ago. It is still on the site but doesn't show up due some changing around of the format.
Now, what interests me is the cluster of future performances that would populate the white space below and above the curve.
Below the curve would be anyone slower than the record.
The deviation percentage couldn't be very much, could it?
Not very much, no. Historically it has not been very much.
bikeerg 75 5'8" 155# - 18.5 - 51.9 - 568 - 1:52.7 - 8:03.8 - 20:13.1 - 14620 - 40:58.7 - 28855 - 1:23:48.0
rowerg 56-58 5'8.5" 143# - 1:39.6 - 3:35.6 - 7:24.0 - 18:57.4 - 22:49.9 - 7793 - 38:44.7 - 1:22:48.9 - 2:58:46.2

User avatar
bloomp
10k Poster
Posts: 1126
Joined: November 28th, 2007, 5:37 pm
Location: Storrs, CT

Post by bloomp » January 28th, 2010, 10:34 pm

So as a 'group' of ergers ages, the percentage by which they beat a WR will continually decrease?

Here's what I'm seeing. Barring a newcomer to a group of people aging across that 10-year span, you will have a very fixed percentage as to how much that group will break the previous groups WR as they approach a specific age. For example, as the people who are in the 30-39 group become 40-49, they will break the WR 2k times by a percentage less than the 20-29 year old rowers who will be 30-39 soon.

Bah forgot to add this: A newcomer completely skews the data because they do not have results from a previous 'group'. With the younger ages (12-18) it makes sense that they wouldn't have data points to compare, but by the time someone is 29, they've probably posted 2k scores for the last 5, probably 10 years. What you could also expect to see is IF a new rower set an age group WR, there would be less of a percentage difference between their WR and the one that beats it.

On a similar note, and I am not sure if this is what you were exactly getting at, there will always be a faster time so there must always be an expectation that the current records will fade. I think we can attribute that to something very positive, the fact that the rowing community has been able to incorporate a rewarding training method at an earlier and earlier age. It doesn't cause athletes to burn out, and hopefully they will continue rowing (and breaking progressive WRs) into their old age.
24, 166lbs, 5'9
Image

User avatar
hjs
Marathon Poster
Posts: 10076
Joined: March 16th, 2006, 3:18 pm
Location: Amstelveen the netherlands

Post by hjs » January 29th, 2010, 4:27 am

bloomp wrote:So as a 'group' of ergers ages, the percentage by which they beat a WR will continually decrease?

Here's what I'm seeing. Barring a newcomer to a group of people aging across that 10-year span, you will have a very fixed percentage as to how much that group will break the previous groups WR as they approach a specific age. For example, as the people who are in the 30-39 group become 40-49, they will break the WR 2k times by a percentage less than the 20-29 year old rowers who will be 30-39 soon.

Bah forgot to add this: A newcomer completely skews the data because they do not have results from a previous 'group'. With the younger ages (12-18) it makes sense that they wouldn't have data points to compare, but by the time someone is 29, they've probably posted 2k scores for the last 5, probably 10 years. What you could also expect to see is IF a new rower set an age group WR, there would be less of a percentage difference between their WR and the one that beats it.

On a similar note, and I am not sure if this is what you were exactly getting at, there will always be a faster time so there must always be an expectation that the current records will fade. I think we can attribute that to something very positive, the fact that the rowing community has been able to incorporate a rewarding training method at an earlier and earlier age. It doesn't cause athletes to burn out, and hopefully they will continue rowing (and breaking progressive WRs) into their old age.
Things you also see is this, above 30 you don,t see many former top otw rowers in teh rankings. They have done there hard work and don,t continue to do this while they start aging and loose some performance. Lot's stop completely, others keep training but don,t push themselves, they just keep fit. You don,t see them in rankings, sometime they pop up years later.

This patern can also bene seen in the age groups.

I have been around here now for 12 years orso, with big breaks, but the people who are on top for a while also stop ranking pieces when they can,t pb anymore.
For instance the 40 and 50 plus cat, you often see here newcomers, coming from an other sport of completely new, If those people are relative talented on the erg and see themselves high in the rankings they often train hard for a while and reach there current max more or less, but after a few years their age is creeping up on them and there performance starts dropping.
At this point most of them also drop out, or stop ranking their rows. I could name many examples from my head but I won,t start naming names.

In short, it's very difficult for people to keep motivated while they start getting less good. We need hard work to be rewarded and if it's not we stop. Makes sense.

User avatar
mikvan52
Half Marathon Poster
Posts: 2648
Joined: March 9th, 2007, 3:49 pm
Location: Vermont

Post by mikvan52 » January 29th, 2010, 9:40 am

hjs wrote:the people who are on top for a while also stop ranking pieces when they can,t pb anymore.
...you often see here newcomers, coming from an other sport of completely new, If those people are relative talented on the erg and see themselves high in the rankings they often train hard for a while and reach there current max more or less, but after a few years their age is creeping up on them and there performance starts dropping....

At this point most of them also drop out, or stop ranking their rows. I could name many examples from my head but I won,t start naming names.

In short, it's very difficult for people to keep motivated while they start getting less good. We need hard work to be rewarded and if it's not we stop. Makes sense.
You bring up some excellent points, my friend.

It seems that human nature gets in the way of knowing how well a lifelong athlete can do if he/she would just "stick with it".
.... not that erging one's entire life away is to be recommend for the sane :lol: :lol: :lol:

I like that many aging erg athletes focus on how well they are doing in the percentiles rather than berating themselves about other measures.

It's also a little skewed that so much emphasis is put on the 2k rather than other distances...
5k to 30 minutes would be a great range for more competitions for the endurance athlete and a fairly manageable one for competitions.
After all: think of the prominence of the "head race" distance OTW....

I've competed at 30min ans 60min at venues... few people show up :?
3 Crash-B hammers
American 60's Lwt. 2k record (6:49) •• set WRs for 60' & FM •• ~ now surpassed
repeat combined Masters Lwt & Hwt 1x National Champion E & F class
62 yrs, 160 lbs, 6' ...

User avatar
chgoss
10k Poster
Posts: 1060
Joined: March 25th, 2006, 1:38 pm

Post by chgoss » January 29th, 2010, 9:48 am

Exactly, focus on getting closer to the top of your age group, regardless of your times, if you're doing that, you're improving.
52 M 6'2" 200 lbs 2k-7:03.9
1 Corinthians 15:3-8

User avatar
mikvan52
Half Marathon Poster
Posts: 2648
Joined: March 9th, 2007, 3:49 pm
Location: Vermont

Post by mikvan52 » January 30th, 2010, 7:22 am

Ok: Here's a graph representing the theme of this thread:

Notice that on the vertical scale, WRs are normalized to what the age 30 lwt record is.

Image

I think others (like hjs) have made great points that 30 to 50 year old 2k WRs don't represent what those ages can really do.

The 2k (green line) is probably more accurate in reflecting max human performance.

In decades to come I think we can say that this curves slope will not change. :idea:
3 Crash-B hammers
American 60's Lwt. 2k record (6:49) •• set WRs for 60' & FM •• ~ now surpassed
repeat combined Masters Lwt & Hwt 1x National Champion E & F class
62 yrs, 160 lbs, 6' ...

User avatar
NavigationHazard
10k Poster
Posts: 1789
Joined: March 16th, 2006, 1:11 pm
Location: Wroclaw, Poland

Post by NavigationHazard » January 30th, 2010, 8:22 am

Wonky response warning.
Conversion of ergometer time to average applied power reveals that average power for the best male and female rowers declines linearly at the same absolute rate of 4 W*yr[sup-1]. The incongruence between the age-power and age-performance time relationships is a mechanical issue, not a physiological one. The relationship between a change in muscular power output and the corresponding change in movement velocity of an object moving through air or water is not linear because of the exponential relationship between movement velocity and the resulting drag force acting on the object (10,11). Power is a third-order polynomial function of velocity whether one is moving through air or water. This relationship is also true for the rowing ergometer used in this study because the resistance is created by a circular wind vane moving through air. Interpretation of performance data from events such as time-trial cycling, flat-water kayaking, on-water and ergometer rowing, and swimming is complicated by this nonlinearity between applied power and velocity. In all of these events, body weight is supported, and air and/or water drag is the primary resistance to movement. In contrast, the impact of wind drag on running is relatively less important compared with the resistance caused by gravity at typical running velocities in endurance events (16-24 km*h[sup-1]).
Gender differences in the pattern of performance decline are also created by the different peak average powers produced by elite men and women. Young men produce higher power outputs than women, but lose power at a similar absolute rate (4 W*yr[sup-1]). Thus, their relative performance power is better maintained (Fig. 5b). Cross-sectionally, the relative power decline in elite men is 0.9% per year versus 1.2% per year in elite women. At young ages where the gender performance difference is most dramatic, the mean external power output sustained by elite men is nearly 50% higher than same-age elite women. Young elite men average 460 W compared to 325 W for their female counterparts. These power values are almost identical to the average power outputs of the 1992 male and female Olympic rowing teams in a 2000-m race simulation (instead of the 2500-m distance used in the present data) on the CII ergometer (467 W, N = 35 men and 310 W, N = 25 women, (4)). The 50% gender difference in ergometer power output in these national team members was paralleled by a 45% difference in absolute VO[sub2max] (6.25 L*min[sup-1] vs 4.37 L*min[sup-1], (4)). This substantial gender difference in external power output is associated with only a 15% greater mean velocity on the ergometer and an 8-10% greater velocity in the boat (where increased body weight in men results in increased boat wetted surface area and attenuates the benefit of increased power). At high ergometer (or boat) velocities, large changes in mechanical power applied to the oar will elicit smaller absolute changes in velocity compared with the same power increment applied at low velocities. Consequently, although mean power declines in parallel in men and women between the mid-20s and mid-50s (Fig. 4b), the impact on rowing ergometer velocity is less substantial in elite young to middle-aged men because they perform on a steeper portion of the exponential power-velocity curve. After this age, men perform on a shallower portion of this curve and performance times decrease more for the same decrement in power. On the basis of the power-velocity relationship, the conversion of performance time to mean power yields a more meaningful quantification of physiological decline across age. This conversion can be made accurately on rowing ergometer performance, but it has relevance to the interpretation of performance data from several other sports where such a conversion is more problematic.
-- Seiler et al., Gender Differences In Rowing Performance And Power With Aging, Medicine & Sport Science 30 121-7 Ja '98.

Translation: This C2-supported study involved a cross-sectional analysis of ranking data. If the authors are right in their conclusions, and they're not stupid men and published their study in a peer-reviewed journal, to understand what seems to be happening with times as people age we really need to be looking at watts.

As we all know, but sometimes forget, there's a cubic relationship between pace and watts. If you go from 4:00/500m pace to 2:00/500 pace on an erg you're going twice as fast. However your wattage has to go from 25.3 to 202.5, i.e. and eightfold increase. That's why it gets harder to improve the faster you go.

Now turn this around and consider age-related decline. Seiler et al. argue that in watts it's a pretty consistent 4 watts/year. If that's true, a rower averaging 202.5 watts over some distance at age 40 (2:00/500 pace) should expect to average 162.5 watts (2:09.1/500 pace) over the same distance at age 50. That's a decline in wattage of 19.75% over the decade, translating into a slowing of pace by 7.6%. By age 60 the same rower at the same rate of decline should expect to average 122.5 watts (2:21.9/500 pace). That's a decline in wattage of 24.6%, translating into a slowing of pace by 9.9%.

See what happens? If Seiler et al. are right, it gets easier to row slower the older you are. Moreover, this inescapable truth is built in to the fundamental physics of erging/rowing.

With regard to world records for LW men, your samples are so small that they're not ever going to let you draw statistically meaningful conclusions.
67 MH 6' 6"

User avatar
mikvan52
Half Marathon Poster
Posts: 2648
Joined: March 9th, 2007, 3:49 pm
Location: Vermont

Post by mikvan52 » January 30th, 2010, 9:51 am

Thanks for providing a citation of that respectable work, Nav'.

I was hoping you'd come forth with your knowledge and resources.
I will study it a greater length before I respond...

User avatar
johnlvs2run
Half Marathon Poster
Posts: 4012
Joined: March 16th, 2006, 1:13 pm
Location: California Central Coast
Contact:

Post by johnlvs2run » January 30th, 2010, 4:10 pm

Decline in performance by age is shown specifically by "2) Select the adjustment for your age",
i.e. the Perathon age adjustments show the precise decline by age.
http://johnlvs2run.wordpress.com/category/perathlon/

Watts decline is shown very simply with the cube of the age adjustments.

For example the age adjustment at age 84 is .7209 of the division WR by time.
The watts adjustment is .7209 cubed which is .5197 of the division WR by watts.
bikeerg 75 5'8" 155# - 18.5 - 51.9 - 568 - 1:52.7 - 8:03.8 - 20:13.1 - 14620 - 40:58.7 - 28855 - 1:23:48.0
rowerg 56-58 5'8.5" 143# - 1:39.6 - 3:35.6 - 7:24.0 - 18:57.4 - 22:49.9 - 7793 - 38:44.7 - 1:22:48.9 - 2:58:46.2

Post Reply